
Back to Page
How to Leverage GA4 Data for Party Rental Business Insights
This articles covers how you can use Google Analytics to answer key questions about your inflatable business.
12 Min Read
Business Intel
July 1, 2024

Dillan

Disclaimer
This is not an in-depth guide for people experience with GA4. Rather, this guide is meant for those who are new to GA4 and “Business Intelligence” metrics. If that sounds like you and you’re interested in leveling up your business with real-time data, then read on.
Intro
Hey! This guide assumes you’ve setup an account for Google Analytics (GA4) and have installed it on your website. If you haven’t done that yet, then check out “How to Setup Google Analytics and Why You Should”. Now that you’ve got GA4 setup, you should be greeted by a page like this one.
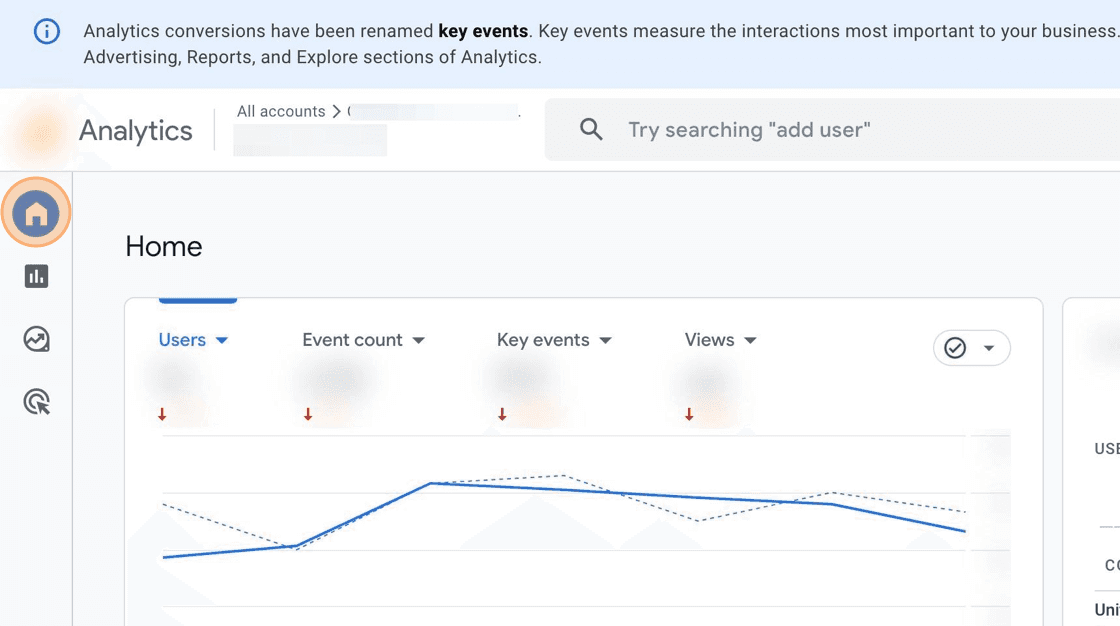
This is your main dashboard and a good place to get a high level view of your sites traffic. But to answer real business questions we’re going to have to dig a little deeper.
GA4 Reports
Google Analytics can be a little overwhelming at first. That’s why we’re mostly going to use the “Reports” section in this guide. This is where Google automatically builds charts and reports that you will find valuable. Here are some example questions for our business, and how we can answer them using Reports.
Which of My Products are Performing Well?
It can be very useful to know which of your products are selling well and which ones aren’t. You can improve advertising for a product thats struggling, buy more of a product thats crushing it, or drop a product all together if its not worth it. To answer this question we’re going to start by clicking “Reports”
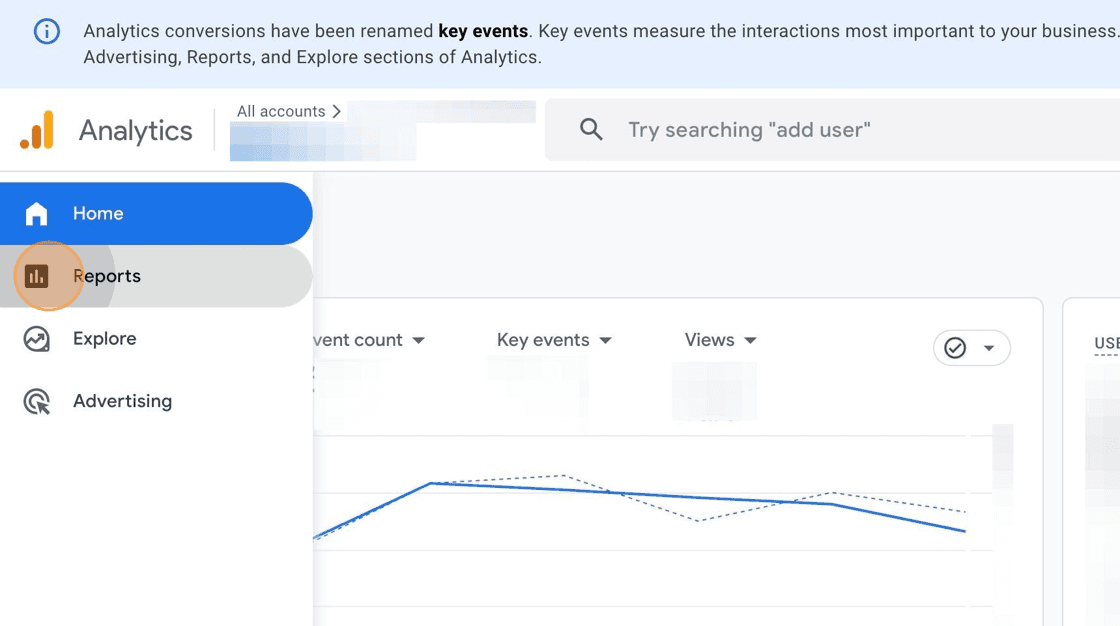
From there, we will open up the “Lifecycle” dropdown, the “Monetization” dropdown, and the “Overview” section.
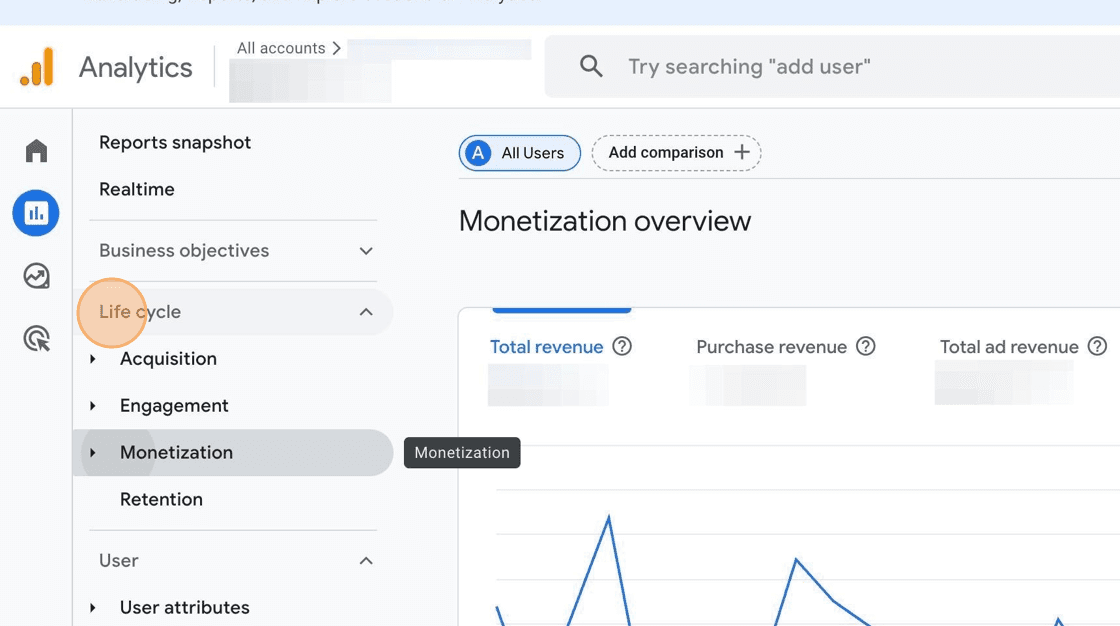
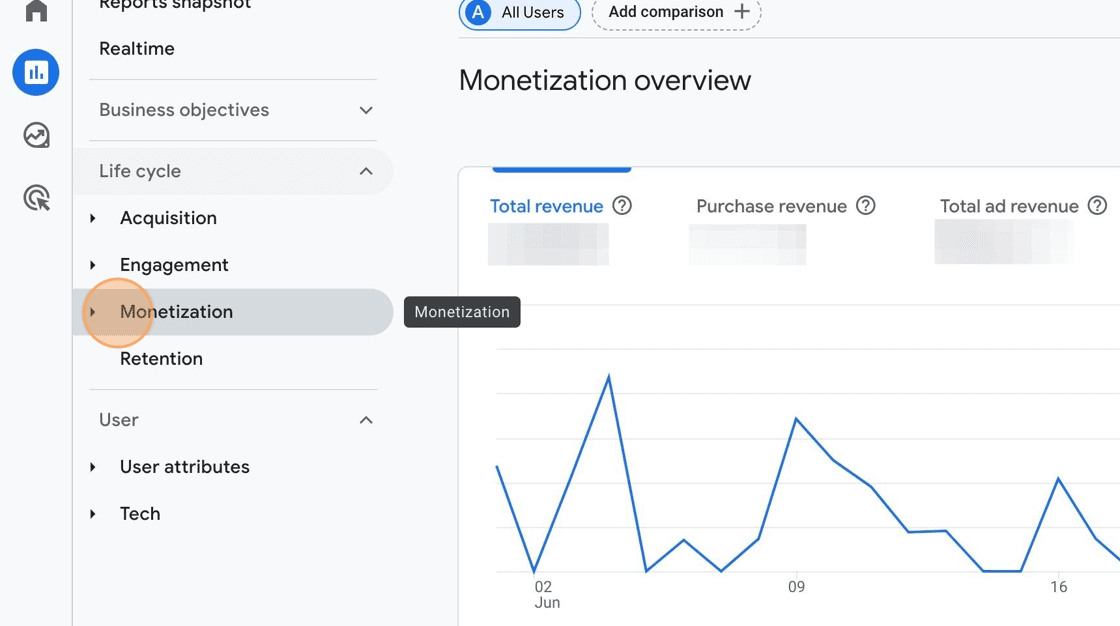
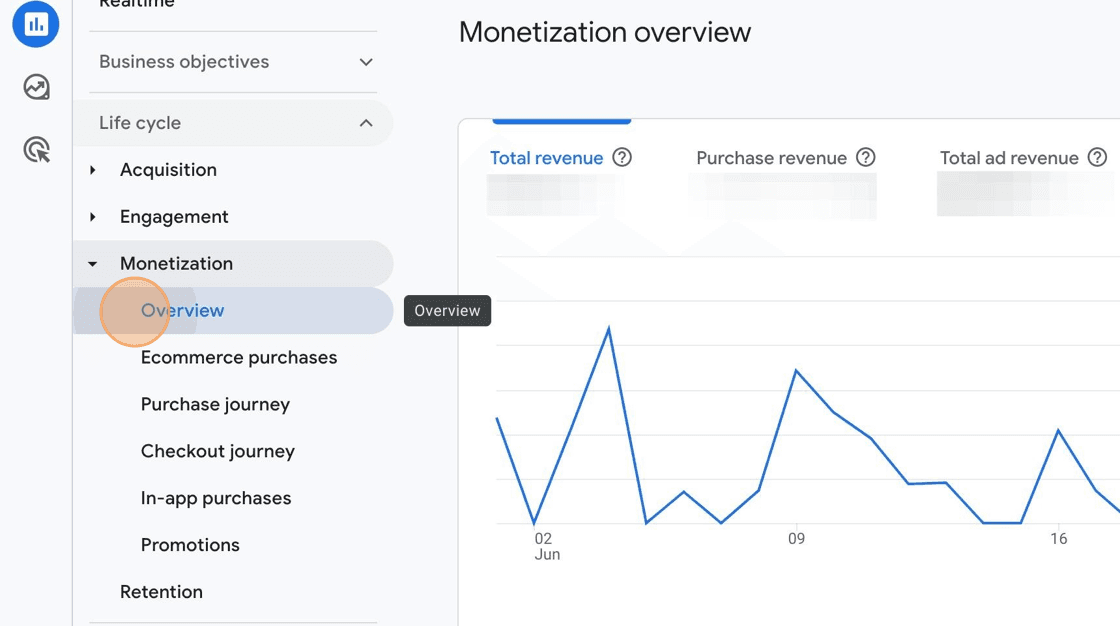
This is your high level e-commerce overview for your site. From here, we’ll scroll down to the “Items purchased by Item Name Table” table and see how my products are doing.

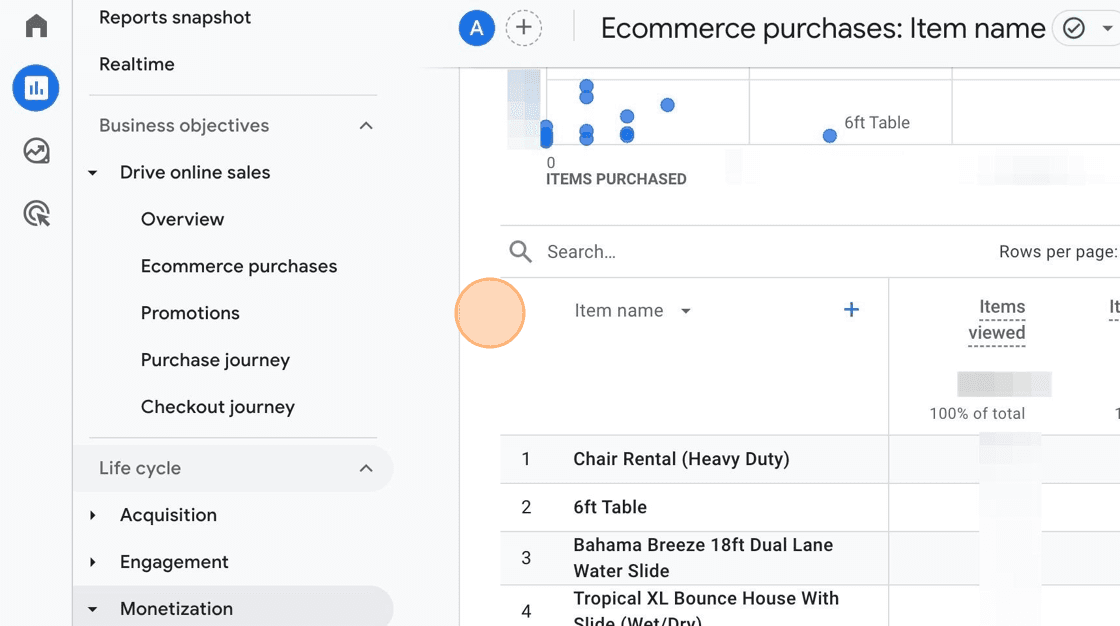
Looks like my heavy duty chairs are killing it! They’re being rented over twice as much as anything else? But how much money is that actually bringing in? I can dig deeper into my products by clicking on “View Items”.
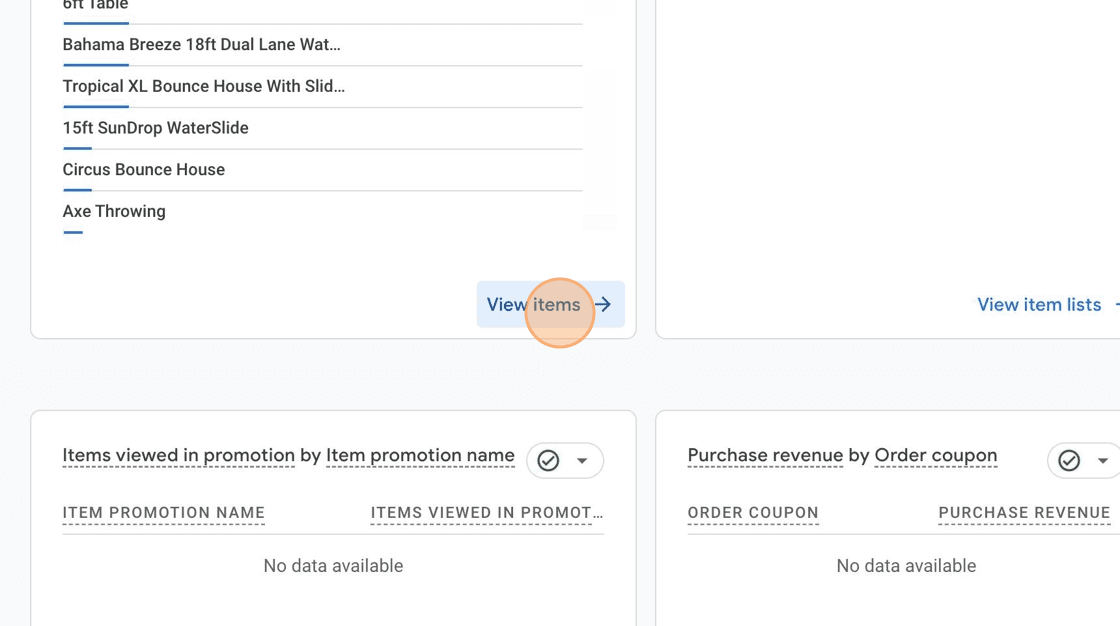
Then I can look at the table found at the bottom to see important metrics like views, purchases, and revenue per product.
How are people finding my website?
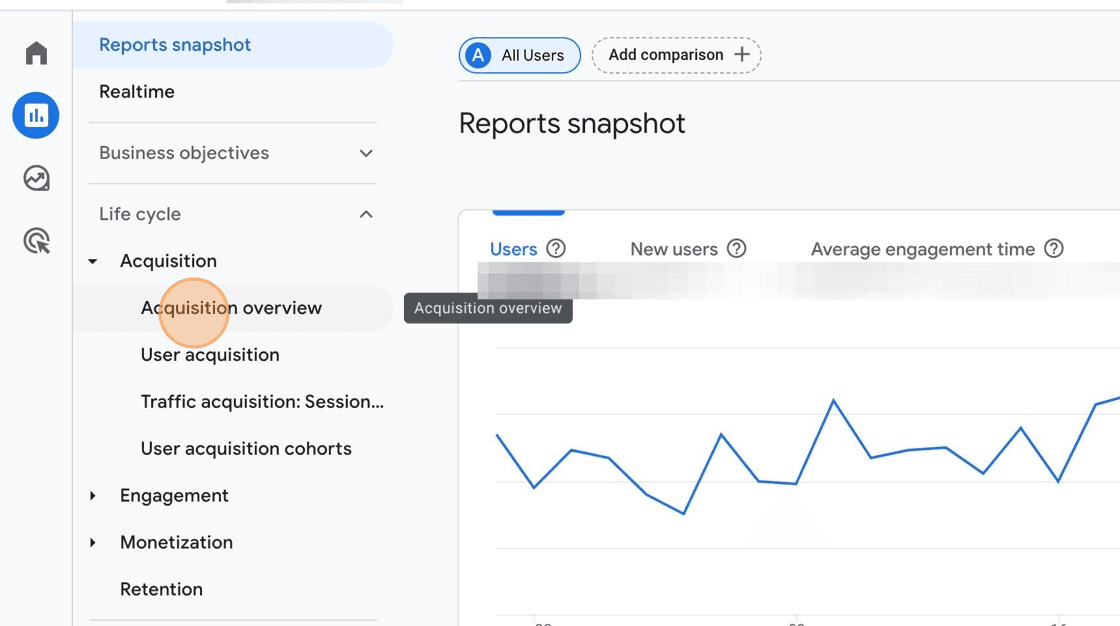
Knowing where your website traffic is coming from can be incredibly helpful in knowing whether your advertising is working or if that Facebook page you started is helping your business or not. To find the report on this we’re going to duplicate the first two steps from the previous question and click on “Reports, then “Life cycle”. After that, we’ll open the “Acquisition” section and go into the “Acquisition overview”.
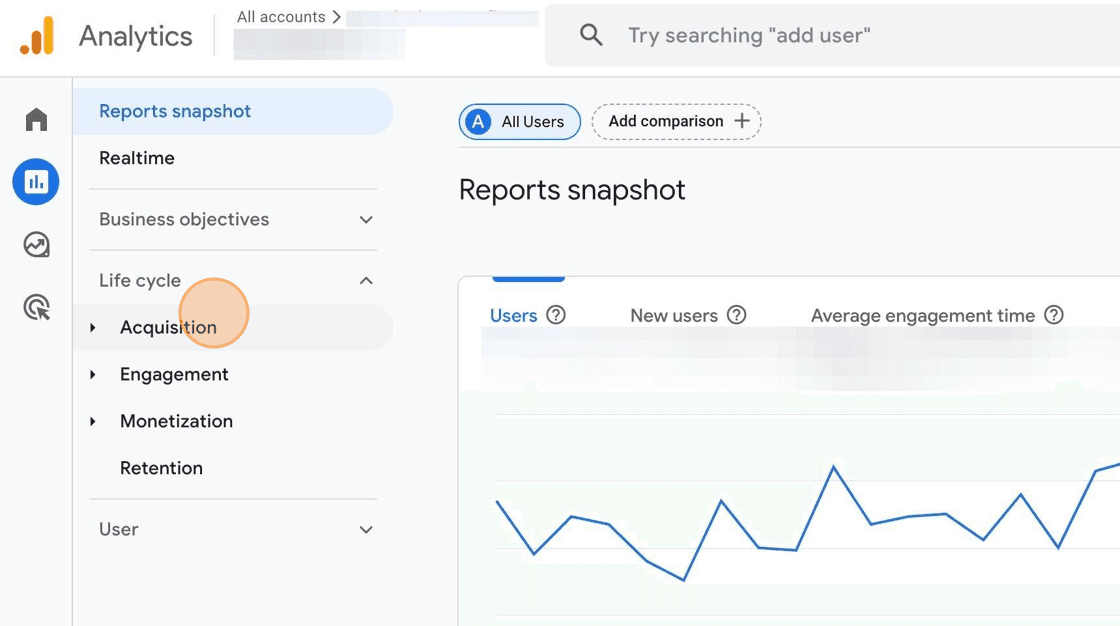
In GA4 “Acquisition” refers to acquiring traffic/users on your site. So you can see a lot of useful data on where your website traffic is coming from using tables like the “New Users by” shown below.
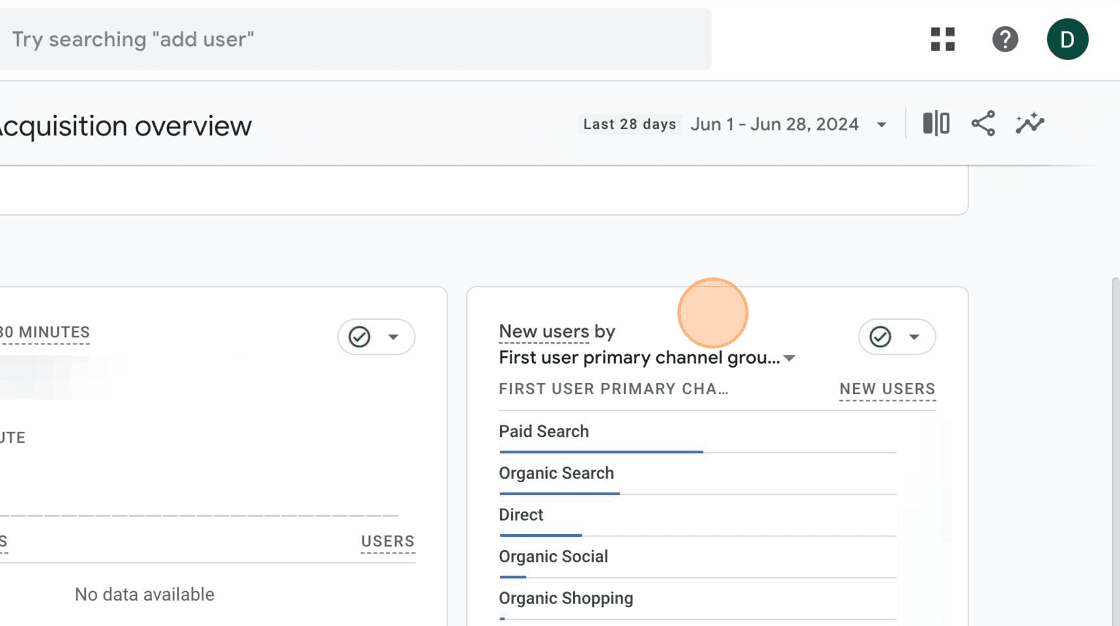
In this example we can see that paid search (ads) is a large part of our traffic, but a good amount are finding our site organically using things like Google Search. We can dig in for a little more detail if we scroll down to the “Sessions by” table, click the second dropdown in the title, and set it to “Session source / medium”
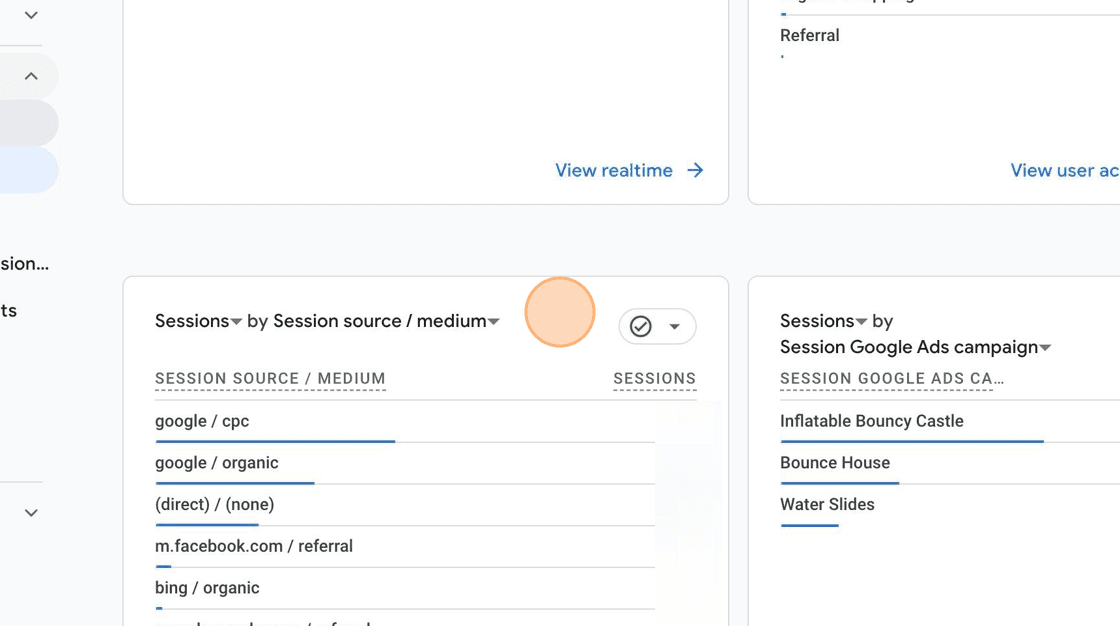
Here the story is pretty similar to the previous table, but we can also see the portion of our users coming from facebook. To the right, we find the answer to our next question
Are My Paid Ads Worth It?
In the previous screenshot in the “Sessions by Google Ads campaign” table we can see how much of our traffic is coming from each ad campaign we’re running. We can get more details by clicking on “View Google Ads campaigns”
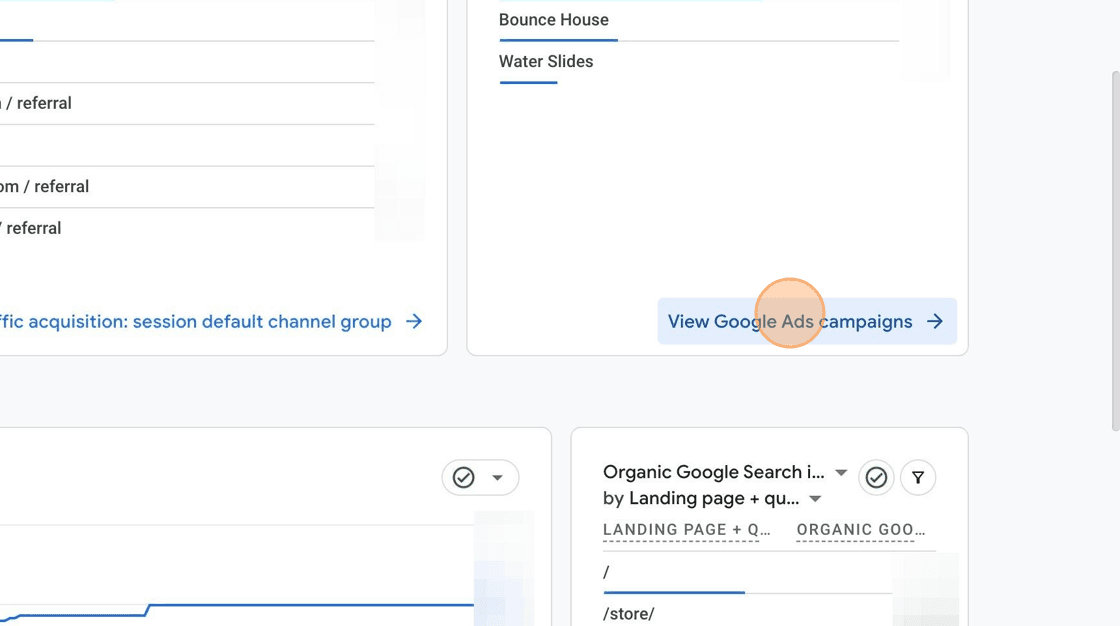
This will change the overview to be focused on your ad campaigns. Then we can dig into how well each of the ad campaigns is doing day to day and make adjustments as needed. Most importantly, you can see the total revenue generated by users coming from your ad campaigns.
Conclusion
With Google Analytics (GA4), you can gain valuable insights into your product performance, website traffic sources, and advertising effectiveness. This information helps you make informed decisions that improve your business. Start using GA4 today to unlock the full potential of your website's data and drive your bounce house business forward. If you have any questions, feel free to reach out.
Disclaimer
This is not an in-depth guide for people experience with GA4. Rather, this guide is meant for those who are new to GA4 and “Business Intelligence” metrics. If that sounds like you and you’re interested in leveling up your business with real-time data, then read on.
Intro
Hey! This guide assumes you’ve setup an account for Google Analytics (GA4) and have installed it on your website. If you haven’t done that yet, then check out “How to Setup Google Analytics and Why You Should”. Now that you’ve got GA4 setup, you should be greeted by a page like this one.
This is your main dashboard and a good place to get a high level view of your sites traffic. But to answer real business questions we’re going to have to dig a little deeper.
GA4 Reports
Google Analytics can be a little overwhelming at first. That’s why we’re mostly going to use the “Reports” section in this guide. This is where Google automatically builds charts and reports that you will find valuable. Here are some example questions for our business, and how we can answer them using Reports.
Which of My Products are Performing Well?
It can be very useful to know which of your products are selling well and which ones aren’t. You can improve advertising for a product thats struggling, buy more of a product thats crushing it, or drop a product all together if its not worth it. To answer this question we’re going to start by clicking “Reports”
From there, we will open up the “Lifecycle” dropdown, the “Monetization” dropdown, and the “Overview” section.
This is your high level e-commerce overview for your site. From here, we’ll scroll down to the “Items purchased by Item Name Table” table and see how my products are doing.
Looks like my heavy duty chairs are killing it! They’re being rented over twice as much as anything else? But how much money is that actually bringing in? I can dig deeper into my products by clicking on “View Items”.
Then I can look at the table found at the bottom to see important metrics like views, purchases, and revenue per product.
How are people finding my website?
Knowing where your website traffic is coming from can be incredibly helpful in knowing whether your advertising is working or if that Facebook page you started is helping your business or not. To find the report on this we’re going to duplicate the first two steps from the previous question and click on “Reports, then “Life cycle”. After that, we’ll open the “Acquisition” section and go into the “Acquisition overview”.
In GA4 “Acquisition” refers to acquiring traffic/users on your site. So you can see a lot of useful data on where your website traffic is coming from using tables like the “New Users by” shown below.
In this example we can see that paid search (ads) is a large part of our traffic, but a good amount are finding our site organically using things like Google Search. We can dig in for a little more detail if we scroll down to the “Sessions by” table, click the second dropdown in the title, and set it to “Session source / medium”
Here the story is pretty similar to the previous table, but we can also see the portion of our users coming from facebook. To the right, we find the answer to our next question
Are My Paid Ads Worth It?
In the previous screenshot in the “Sessions by Google Ads campaign” table we can see how much of our traffic is coming from each ad campaign we’re running. We can get more details by clicking on “View Google Ads campaigns”
This will change the overview to be focused on your ad campaigns. Then we can dig into how well each of the ad campaigns is doing day to day and make adjustments as needed. Most importantly, you can see the total revenue generated by users coming from your ad campaigns.
Conclusion
With Google Analytics (GA4), you can gain valuable insights into your product performance, website traffic sources, and advertising effectiveness. This information helps you make informed decisions that improve your business. Start using GA4 today to unlock the full potential of your website's data and drive your bounce house business forward. If you have any questions, feel free to reach out.


©Party Rental Platform
All Rights Reserved 2024
©Party Rental Platform
All Rights Reserved 2024
©Party Rental Platform
All Rights Reserved 2024